Representing 3D surfaces, f( x, y)
To a mathematician or scientist, we can summarise such shapes as say:-
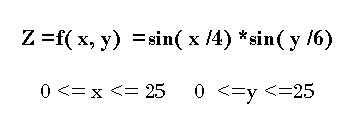
And the values of this function in a given range can be calculated- here, by a spreadsheet, but equally easily in LB or JB.
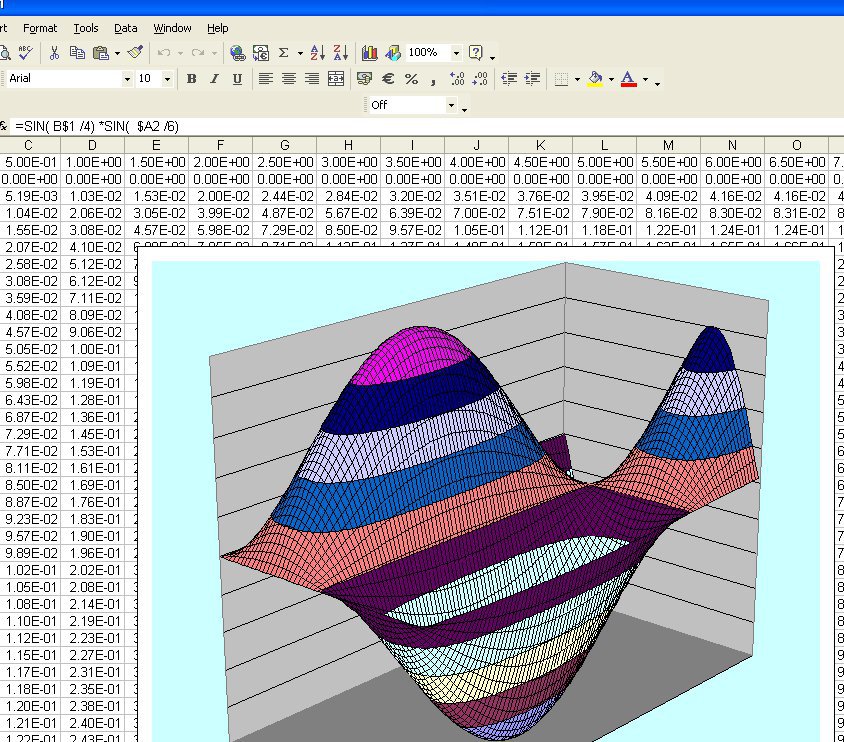
However, the ways to show the data visually are very limited even in a paid-for spreadsheet like Excel ( I use the free Open Office) It is of course also possible to use much more inscrutable software (say GnuPlot) or expensive ( Mathematica), but writing your own software is much more fun.
My previous experiments gave results like
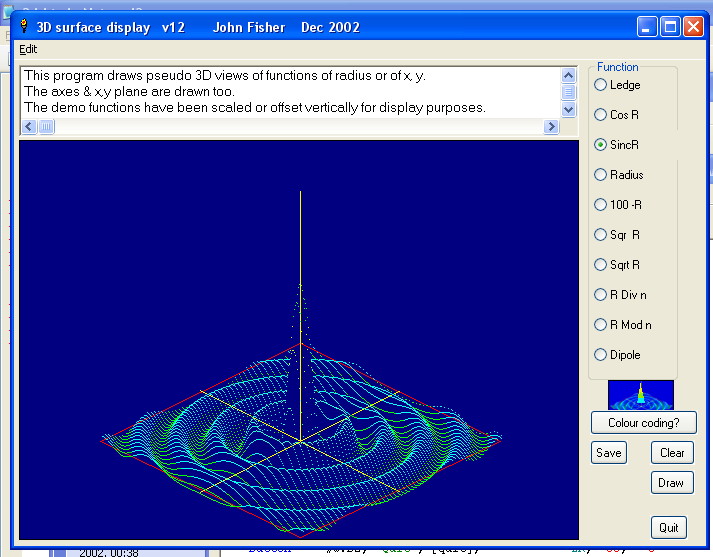
With source available at my LB pages
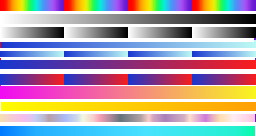
Then, recent discussions on coding colour graduations encouraged me to play further. The following are experiments in displaying information about 3D surfaces, where the value is a function of x and y. They include experimenting in wire-frame drawing; colour coded 2D projections, and perspective 3D views with various ways of encoding magnitude.
Since this is on-going (as of Nov 2009) I'll just include the present version. I've found the technique of drawing a colour gradient in a graphics program, then examining its pixel colours to set up LB'ss 'color' commands to be more powerful than algorithically calculating sequences. I'll put up a zip file soon with the colour sequences included.... meanwhile visit here where I put previous experiments. Or save the following JPG and convert it to JPG in a painting program.
    '   To-dos
    '       If z mod 10 =0 set point in black
    '       Use mouse to choose colour band rather than sequence, and make one-shot
    '       Add exit button
    '       Make save a button option
    '       Make function user-enterable
    '       Make prog scan for max & min and auto scale.
    '       Add option to print
    '       Add menu for help, save, add function & exit
    '       Make the colour-scales all have a zero-band in contrasting colour?

    nomainwin

    UpperLeftX    = 200
    UpperLeftY    = 100
    WindowWidth   = 800
    WindowHeight  = 600

    graphicbox #w.g0,  10, 10, 256, 140
    graphicbox #w.g1, 300, 10, 470, 500
    graphicbox #w.g2, 270, 10,  20, 140

    dim ColLookUp$( 256, 12), v( 12)

    open "Surf3D5" for graphics_nsb as #w

    #w.g1, "down ; fill black ; size 1"
    #w.g2, "down ; fill blue"

    #w, "trapclose [quit]"

    handleg0 =hwnd( #w.g0)
    calldll #user32, "GetDC", handleg0 as ulong, hDC as ulong

    loadbmp "Scale", "QuadSpectrum.bmp"             '   NB must be a 24 bit bmp...
    #w.g0, "down ; drawbmp Scale 0 0"
    #w.g0, "flush"

    for l =1 to 11                                  '   since my bmp has 11 graduated colour stripes
            read yy                                 '   which is how far down next colour stripe is centred
            v( l) =yy
            for v =0 to 255
                 calldll #gdi32, "GetPixel",_
                    hDC as long,_
                    v   as long,_
                    yy  as long,_
                    pixcol as long

                bl = int(  pixcol /( 256*256))
                gr = int( (pixcol               -bl *256*256) / 256)
                re = int(  pixcol               -bl *256*256 - gr *256)

                ColLookUp$( v, l) =str$( re) +" " +str$( gr) +" " +str$( bl)
            next v
            scan
    next l

    unloadbmp "Scale"

    callDll #user32, "ReleaseDC",_
        handleg0 as word,_                          '   handle of graphic box
        hDC as word,_                               '   dc from GetDC
        result as ushort                            '   returns non-zero if successful

    c =-1

[start]
    timer 0
    c =( c +1) mod 11                               '   choose in turn each of 11 colour sequences. ( c =0 to 10)
    ch =c +1                                        '       ch =1 to 11
    #w.g2, "goto 10 "; v( ch); " ; down ; color red ; backcolor red ; circlefilled 5 ; up"
    for y =199 to 0 step -1
        scan
        for x =0 to 399
            z =func( x, y)
            #w.g1, "color "; ColLookUp$( abs( z), ch)
            #w.g1, "line ";  x +y /4; " "; 300 -y /4 +z; " "; x +y /4; " "; 300 -y /4
        next x
    next y

    sv$ ="Surf3D5"; str$( ch)
    #w.g1, "flush ; getbmp "; sv$; " 0 0 399 399"
    bmpsave sv$, sv$+".bmp"
    unloadbmp sv$
    #w.g1, "cls ; fill black"
    #w.g2, "goto 10 "; v( ch); " ; down ; color white ; backcolor white ; circlefilled 4 ; up"
    timer 2000, [start]
    wait

    data 5, 18, 33, 44, 53, 62, 80, 93, 105, 118, 129

    function func( x, y)
    func =254 *sin( y /40) *sin( x /20)   '   range -254 to +254
    end function

[quit]
    confirm "Really exit?"; answer$
    if answer$ ="no" then goto [start]
    close #w
    end