Fourier Synthesis & Fourier Analysis of waves.

Here a pure 440 Hz sine wave was generated for 3 seconds.
This time, it is a three second voice-sample.
This time, it is a three second voice-sample.
Imagine a series of slider controls which can fade up and down a whole series of pure tones at a series of frequencies from the lowest you can hear (below 30 Hz) to the highest (say 20 kHz if you are young!).
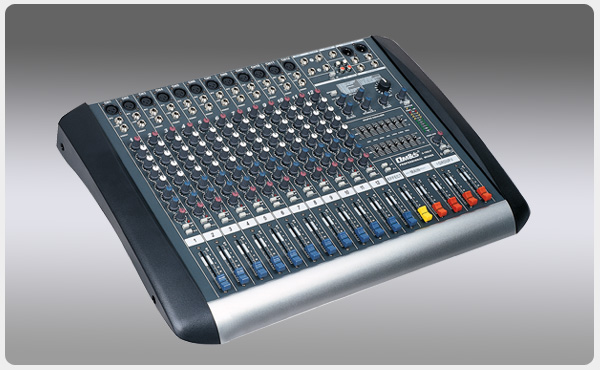
By trial and error you can manipulate them until the output matches any supplied tone. That's good enough for the ear, which detects frequencies but not phases. To match them as displayed on an oscilloscope, you have to be able to shift the phase of each component, or, as above, use both sin and cos components.
In the real world, the signal- perhaps an audio sample- will be digitally sampled. It will keep changing, so we have to keep checking, requiring short sample periods. But short sample periods mean you will not be able to detect low frequencies. The digital processes will also generate false signals- 'aliasing'- if your sampling and signal frequencies aren't multiples of each other. And you've got to be careful not to sample signals at above half their highest frequency component- the 'Nyquist criterion'.
In 'frequency domain' we are interested in how much of each component frequency is present in a 'signal' wave.

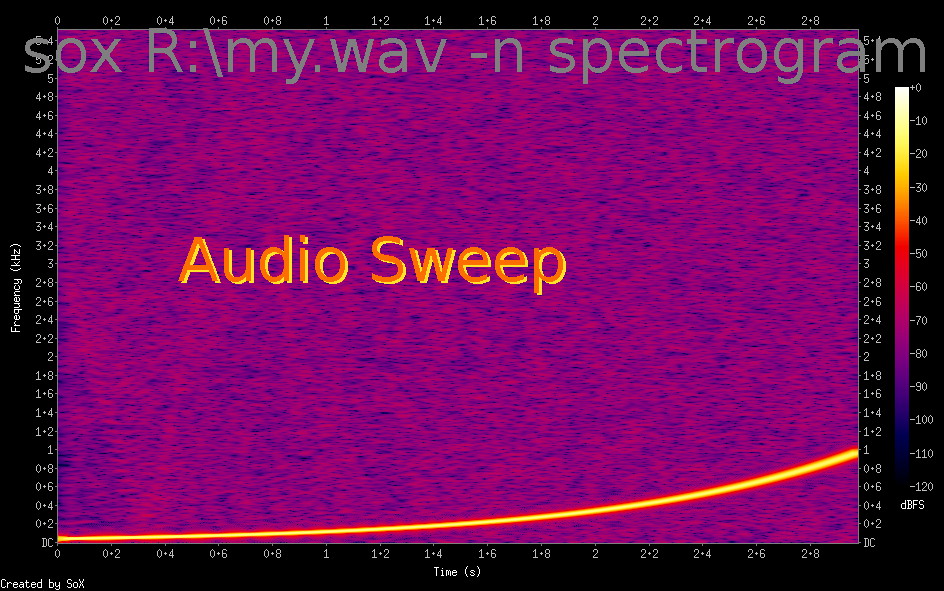
If you are happy with sin waves, it is easy to generate a single pure tone; one which gives a decaying amplitude tone; a swept-frequency constant amplitude sample; an amplitude-modulated tone; 'beats'; a square or triangular wave; etc.
Given the data on frquencies and amplitudes over time, you can synthesise a plucked string or a human voice speaking... I've even had fun generating waveforms that look like a human face profile on an oscilloscope display!
In BASIC the multiple loops take ages. It can be shortened ( the 'Fast Fourier Transform') but then it is harder to see what is happening. More practically, you'd use a pre-compiled fft dll ( the 'Fastest Fourier Transform in the West'- fftw.dll.) However, programming the transform in terms of its definition, and applying it to real waves, is a great way to get real understanding.
If you choose to install the SOX project software ( free download) you get a command-line ability to do all sorts of audio processing and transforming, including producing (Fourier) spectrograms. I'll put up a proper LB frontend to this soon... Typical result below confirms my slow Fourier results- but is produced MUCH quicker.
Fourier transformation is a magic idea and well worth investigating for its implications and applications in sound, images, etc. You can do things like pass-band filtering; frequency up and down converting; voice analysis.
It's extension into 2D allows fascinating work in image analysis, and in 3D in tomography. For images, mix ImageMagick with LB and you have the needed high speed. For 3D, you might wait several days unless you can write machine-level code on a fast machine!!