Testing Pseudo-Random Number Generators.
The program which produced the screen sampled above includes several PRNG algorithms. In each case, numbers are thrown between 0+ and 100. Each single number is assigned one of a hundred 'bin's to produce a histogram of the number-frequency. This histogram self-scales- when one bin reaches grap maximum, it rescales all bins by 0.5 and continues, leaving a 'ghost' of the state at the instant the recent max was reached. It also totals how many were above and below 0.5.
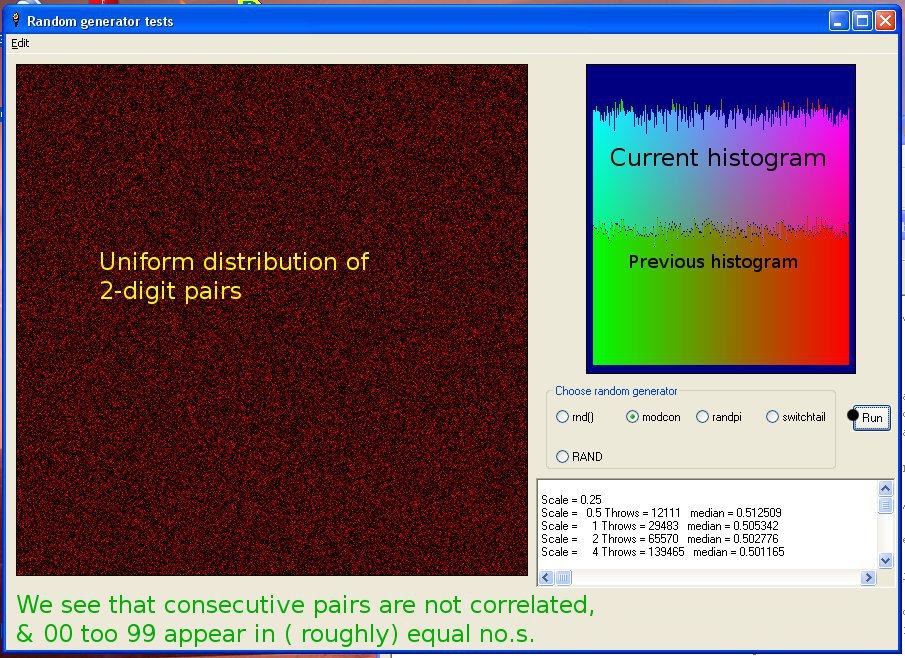
Each successive pair of numbers is used as 2D coordinates to address a pixel on a 512x512 screen and increment its colour. If there is no correlation, all pixels should fade-up in brightness at roughly the same rate, and there should be no regular grouping or clustering on lines. Beware- the human eye/brain often sees pattern in randomness, and you end up believing in canals on Mars!
The screen-grab needs viewing at high brightness to see the 'uniformly random' ( !) dots. Try selecting the switchtail and running it, to see a very different and high correlation...
The methods I've included are:-
I intend to add a routine which downloads 'real' randoms from a web source based on radioactivity or atmospheric noise. I'd actually quite like to try making one- I enjoy hardware projects. I'd also code the Mersenne twister if I really understood it! The main aim was to give a quick demo of strengths or deficiencies of certain algorithms. It might also be worth checking operation of the LB 'randomise( ' function, which effectively starts the PRNG at a predictable place so you get the same run of numbers (Useful for testing programs).
I strongly recommend reference to Wikipedia and other sources.
The program has known bugs- it is intended to be left running on one selection. Don't cover or minimise it's screen, or try to change type mid-run....