 -
-  -
- 
 -
- 
Rosetta Code posted a task which interested me -Total circles area.
Given some wholly /partially overlapping circles on the plane, compute and show the total area covered by them, with four or six (or a little more) decimal digits of precision. The area covered by two or more disks needs to be counted only once.
It is a simple problem that can be solved by applying repeated Pythagoras calculations- but could also be worked on by creating an image and then counting pixels.
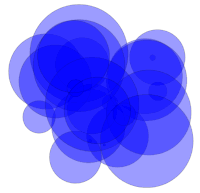
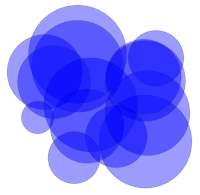
Actually, my first thought was 'How did they generate the supplied coordinates?' The first three images are from the RC page: the next two from a first look at a solution. For at least one algorithm it will pay to sort the circles by size first.
- -
-
We keep generating random candidate circles, but only accept those whose position ( checked against all existing circles) is within the distance given by their own radius plus AT LEAST one of the existing ones.
nomainwin

'randomize 0.5                               '   so repeatable, while testing.

dim x( 100), y( 100), r( 100)

WindowWidth  =550
WindowHeight =580

open "Overlapping circles" for graphics_nsb as #wg

#wg "trapclose quit"
#wg "fill cyan ; down ; color darkblue"

count =1

do
    x   = 86 +380 *rnd( 1)                  '   new candidate circle
    y   = 76 +380 *rnd( 1)
    r   =  5 + 80 *rnd( 1)

    OK  =0

    if count <>1 then
        for ch =1 to count                   '   test against existing accepted circles
            D   =dist( x, y, x( ch), y( ch))
            print D, r( chk), r
            if  D <= ( r( ch) +r) then OK =1
        next ch
    else
        OK   =1
    end if

    if OK =1 then                           '   close enough to overlap
        bc$ =str$( int( 150 +100 *rnd( 1))) +" "_
            +str$( int( 150 +100 *rnd( 1))) +" "_
            +str$( int( 150 +100 *rnd( 1)))
        #wg "backcolor "; bc$
        #wg "place "; x; " "; y
        #wg "circlefilled "; r

        x( count) =x: y( count) =y: r( count) =r

        count =count +1
    end if

    scan
    print
loop until count >25

#wg "flush ; getbmp scr 1 1 550 560"
bmpsave "scr", "screen" +str$( time$( "ms")) +".bmp"

wait

end

sub quit h$
    close #h$
    end
end sub

function dist( x0, y0, x1, y1)  'distance b tween two points in 2d space
    dist =( ( x1 -x0)^2 +  ( y1 -y0)^2 )^0.5
end function
We check the in/out situation at each point of a fine grid across the appropriate bit of the x/y plane. Pythagoras tells us if we are inside any circle.. we can skip out of the test loop if so.
By also doing a simultaneous record at two coarser spacings, we get three values that will be increasingly better. We then use these to predict an even more accurate result.. the method is attributed to Shanks. It allows you to get a nuch mre accurate value from a small number of increasingly accurate values. Foer example, applied to the slow-converging simple series calculation for pi, it gets more close after ....................
dx =0.01
print time$()

'read in the data; I reordered them in descending order of radius
'This maximises our chance of being able to break early, saving run time,
'and we needn't bother finding out which circles are entirely inside others
data  -0.5263668798,  1.7315156631,  1.4428514068
data  -0.1403562064,  0.2437382535,  1.3804956588
data   1.4685857879, -0.8347049536,  1.3670667538
data  -0.5258728625,  1.3782633069,  1.3495508831
data   1.5293954595,  0.0030278255,  1.2472867347
data   1.4637371396,  0.9463877418,  1.1846214562
data  -1.4944608174,  1.2077959613,  1.1039549836
data   1.4168575317,  1.0683357171,  1.1016025378
data  -0.249589295,  -0.3832854473,  1.0845181219
data  -1.2197352481,  0.9144146579,  1.0727263474
data  -0.6855727502,  1.6465021616,  1.0593087096
data   0.0152957411,  0.0638919221,  0.9771215985
data   0.6110294452, -0.6907087527,  0.9089162485
data   1.7813504266,  1.6178237031,  0.8162655711
data  -0.4319462812,  1.4104420482,  0.7886291537
data  -0.6294854565, -1.3078893852,  0.7653357688
data  -0.1389358881,  0.109280578,   0.7350208828
data  -1.7011985145, -0.1263820964,  0.4776976918
data   0.8055826339, -0.0482092025,  0.3327165165
data   1.7952608455,  0.6281269104,  0.2727652452
data  -0.6311979224,  0.7184578971,  0.2491045282
data   0.3844862411,  0.2923344616,  0.2375743054
data   1.6417233788,  1.6121789534,  0.0848270516
data  -0.1985249206, -0.8343333301,  0.0538864941
data   0.2178372997, -0.9499557344,  0.0357871187


dim x( 25), y( 25), r( 25)  ', gx, gy, A0, A1, A2, A
'dim as integer i, cx, cy

for i = 1 to 25
    read a: x( i) =a    '   LB does not read direct into an array...
    read a: y( i) =a
    read a: r( i) =a
next i

for gx = -2.6 to 2.9 step dx     'sample points on a grid
    cx = cx +1
    for gy = -2.3 to 3.2 step dx
        cy = cy +1
        for i = 1 to 25
            scan
            if dist( gx, gy, x(i), y(i)) <= r( i) then
                'if our grid point is in the circle
                A2 = A2 +dx^2     'add the area of a grid square
                if cx mod 2 = 0 and cy mod 2 = 0 then A1 = A1  +4*dx^2
                if cx mod 4 = 0 and cy mod 4 = 0 then A0 = A0 +16*dx^2
                'also keep track of coarser grid areas of twice and four times the size
                exit for
            end if
        next i
    next gy
next gx

'use Shanks method to refine our estimate of the area
A = ( A0 *A2 -A1^2) / (A0 + A2 - 2 *A1)
print A0, A1, A2, A
print "Hoping for   21.56503866963273"
print "Grid step of 0.01 takes 10 minutes to get 3 s.f."
print time$

end

function dist( x0, y0, x1, y1)      'distance b tween two points in 2d space
    dist = sqr( ( x1 -x0)^2 +  ( y1 -y0)^2 )
end function